Introduction
Sustainable heat and power generation from biomass are at the center of scientific and industrial interest owing to the increasing awareness of limiting the availability of fossil fuels [1]. Biomass is environmental friendly as well as abundant in nature.
Combustion of a biomass particle is quite complex as it undergoes various physical and chemical processes including drying, devolatilization/pyrolysis and char burnout [2]. Thus, pyrolysis process is one of unavoidable step during the biomass utilization for heat and power generation and need to investigate carefully at combustion conditions [3].
In the present work, pyrolysis of different biomass is carried out in non-isothermal conditions. Biomass as fuel is currently under research because it has certain major drawbacks. The large varieties of heterogeneous biomass feedstock are available in nature whose properties are required to characterize. The de-polymerization of biomass feedstock results in varieties of different chemical depending upon its composition, can corrode equipment, introducing further reactor design and configuration issues. Nevertheless, depleting fossil fuels are expected to wider use of biomass and the implementation of new technologies and processes.
Characterization of biomass
Physical characterization
Biomass is low in carbon (roughly between 30 wt% to 40 wt% on dry, ash-free basis) and high in volatile matter and oxygen, which result in low calorific values. But significant advantage of biomass with respect to coal is that the contents of nitrogen and especially sulfur are low. Proximate and ultimate analyses of biomass are carried using TGA and CHNOS analyzer respectively. Table 1 proximate analysis and Table 2 shows ultimate analysis.
Table 1. Proximate analysis of different biomass
|
Biomass
|
Proximate analysis (dry basis, wt %)
|
||
|
Volatile matter
|
Fixed carbon
|
Ash
|
|
|
Corn cob
|
71.41
|
25.75
|
2.84
|
|
Cotton stalk
|
66.16
|
27.15
|
6.68
|
|
Ground nut shell
|
64.63
|
29.45
|
5.91
|
|
Rice husk
|
61.23
|
14.96
|
17.08
|
Table 2. Ultimate analysis of different biomass
|
Biomass
|
Ultimate analysis (wt %)
|
|||
|
Carbon
|
Hydrogen
|
Nitrogen
|
Oxygen
|
|
|
Corn cob
|
43.8
|
6.41
|
0.64
|
49.13
|
|
Cotton stalk
|
44.19
|
6.3
|
0.74
|
48.74
|
|
Ground nut shell
|
42.02
|
5.8
|
1.88
|
50.28
|
|
Rice husk
|
34.87
|
5.3
|
0.8
|
59.01
|
*Oxygen is calculated by difference.
From the Table 2 we can correlate between hydrogen/oxygen (H/O) and carbon/oxygen (C/O) ratios which is used to predict the energy content. The materials with a relatively low O/C ratio have more energy density and higher HHV.
Chemical characterization of biomass is carried out using Fourier transform infrared spectroscopy (FTIR), to know the presence of functional groups in the biomass. Figure 1 shows that different kinds of functional groups that are present in the biomass.

Figure 1. Characterization of Biomass using FT-IR.
Wave number (cm-1) 3392 represents the O–H stretch and H–bonded, presence of this functional group has much higher concentration in cotton stalk when compare to other biomass, 2922 represents H–C=O: and C–H stretch in the cotton stalk and rice husk has same concentration, 1639 represents –C=C– stretch in cotton stalk and groundnut shell has same concentration, 1051 represents C–N stretch and =C–H bend in the cotton stalk and rice husk has same concentration, 609 represents –C(triple bond)C–H: C–H bend in the cotton stalk and rice husk has same concentration.
The determination of chemical composition biomass is used to predict the release of compounds during the pyrolysis. In species evolution of pyrolysis, end products are predicted using FTIR technique applied to char at different temperatures.
Experimental set-up and procedure
The thermal decomposition behavior of wood was studied in a thermo-gravimetric analyzer (TGA, Perkin-Elmer Diamond) with horizontal TG/DTA holder having a least count of 0.1 µg. To achieve pyrolysis condition, nitrogen gas was used as oxygen free environment. The constant volume flow of nitrogen was set to 200 mL/min.
Experimental procedure is described below:
Pyrolysis was carried out at non-isothermal conditions. TGA data was
taken at different heating rates as 10 20, 30, and 40 K/min in the temperature
range of 383–1123 K at the end of the heating process, isothermal mode was set for
10 min to ensure that the process is completed. Typical thermo-gravimetric
behavior of biomass decomposition is shown in
Figure 2. From the figure 2, it is observed that, the thermal decomposition
starts at approximately 500 K, following a major loss of weight at 630 K.

Figure 2 TGA profiles of different biomass at 20 K/min.
Figure 2 shows the pyrolysis profiles of different biomass with temperature. It is observed from figure that pyrolysis rates for different biomass is different, this can be explained using the mineral content in ash of biomass and specifically potassium in form oxide acts as catalyst for biomass pyrolysis. The K2O of corncob, cotton stalk, groundnut shell and rice husk is 44.81%, 15.84%, 10.70% and 1.75% respectively. These results are in-line with Raveendran et al. (1995) [4].
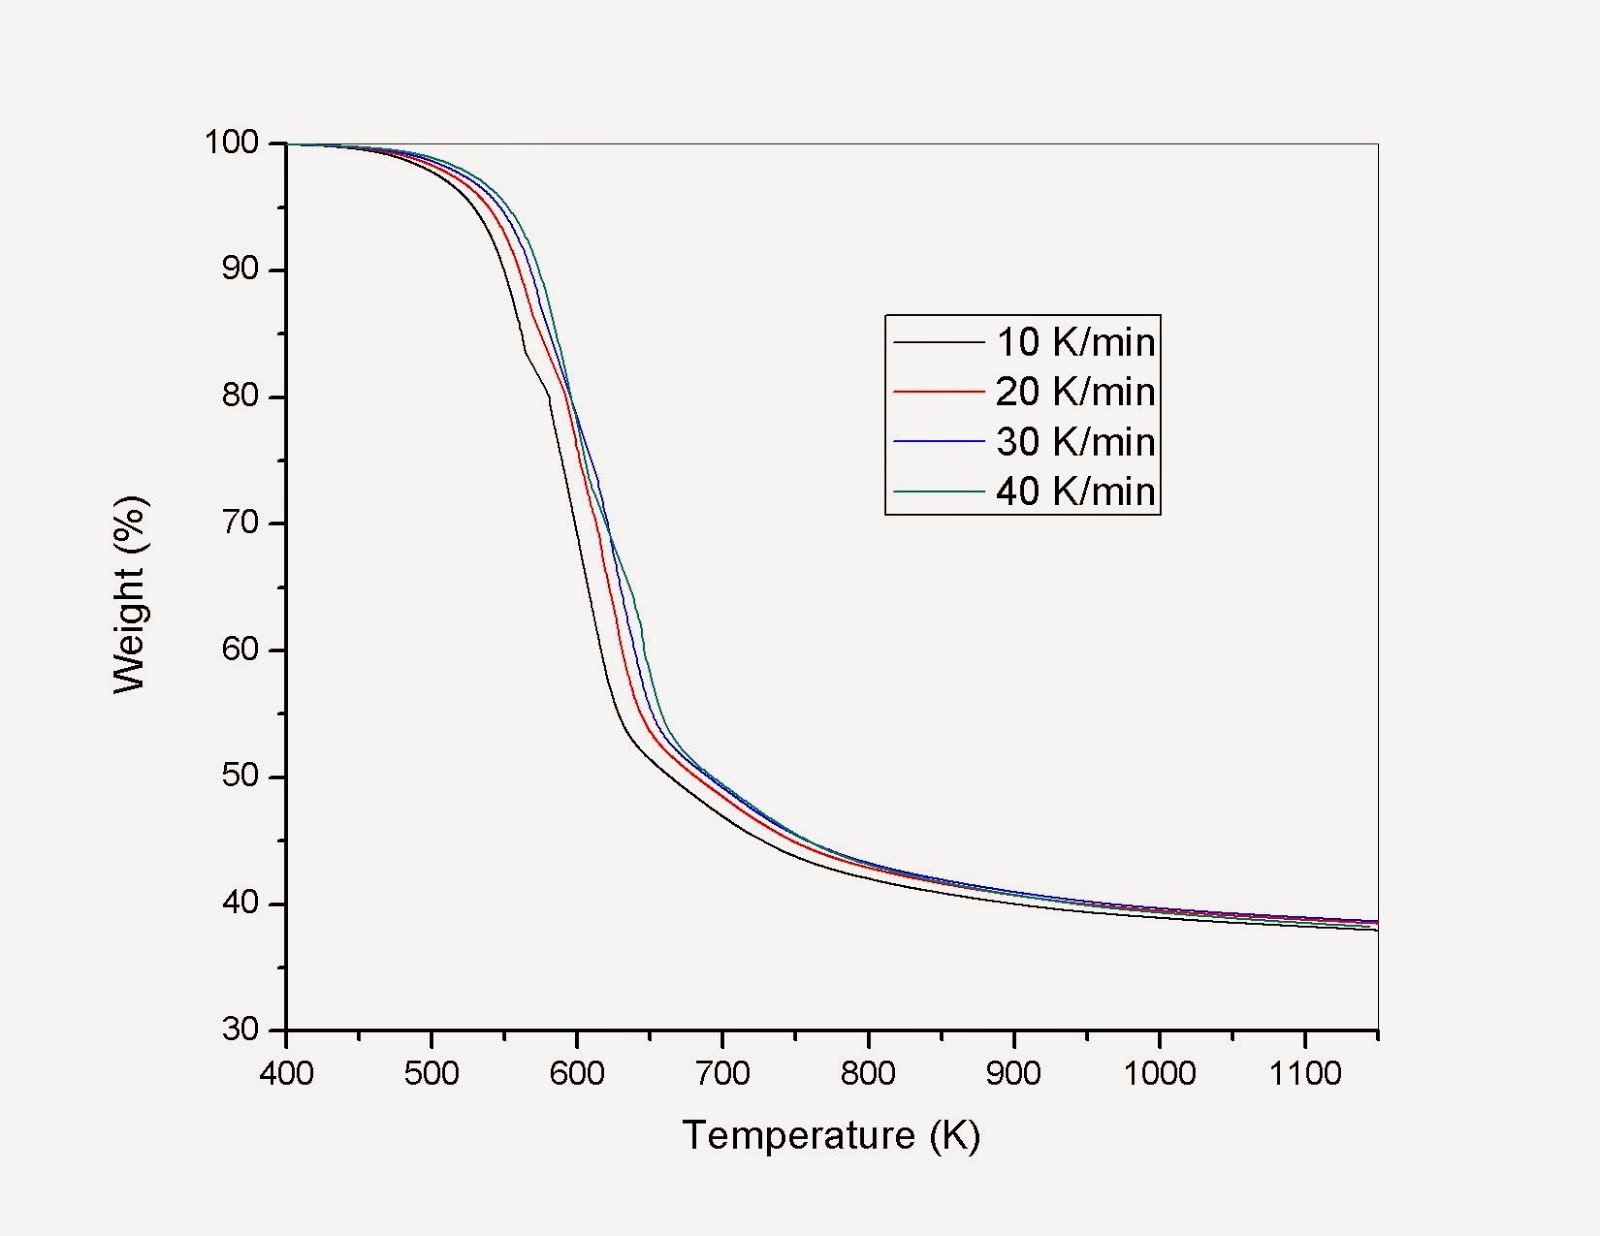
Figure 3. Pyrolysis profiles of different biomass.
Profiles in Figure 3 indicate that the pyrolysis of biomass depends on the heating rate. As heating rate increases pyrolysis rate decreases, due thermal conductivity of the biomass particle.
Conclusions
Thermo-gravimetric studies show that each kind of biomass has unique pyrolysis characteristics, by virtue of the specific proportions of the components present in it. The influence of ash, specifically K2O on pyrolysis rate has studied.
References
[1] C. Di Blasi, “Modeling chemical and physical processes of wood and biomass pyrolysis,” Prog. energy Combust. Sci., vol. 34, pp. 47–90, 2008.
[2] Y. Haseli, J. A. Van Oijen, and L. P. H. De Goey, “Modeling biomass particle pyrolysis with temperature-dependent heat of reactions,” J. Anal. Appl. Pyrolysis, vol. 90, no. 2, pp. 140–154, 2011.
[3] X. Zhang, M. Xu, R. Sun, and L. Sun, “Study on Biomass Pyrolysis Kinetics,” J. Eng. Gas Turbines Power, vol. 128, no. 3, p. 493, 2006.
[4] K. Raveendran, A. Ganesh, and K. C. Khilar, “Influence of mineral matter pyrolysis characteristics on biomass,” fuel, vol. 74, no. 12, pp. 1812–1822, 1995.